How To Produce Semantically Correct MathML From XaTeX/LaTeX (and other accessibility ideas)
During a recent run-in with the a university accessibility department, I learned that they’re writers lacked somewhat in their abilities. They wrote “image” where a simple diagram is shown, and “print out picture of output” where a piece of code lies. I figure they could use some help creating files for the visually impaired. Here’s a quick guide!
Diagrams
Most unexplained diagrams I saw were ones which mirrored classic computer-science imagery; these diagrams, for the most part, were not complex nor exotic; they are straight-forward to explain in writing, or easy to turn into a table. I’ll show two examples here, one will show a visual aide in relation to stacks and queues, and the other will show a memory representation of a stack. Both of these were explained as “image” to the student.
Stacks
Diagram 1:
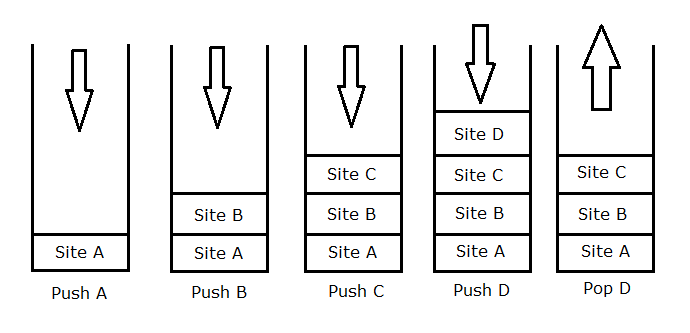
Ok, so here we have a diagram showing the pushing and popping process of a stack. Now, “image” is hardly sufficient to explain this, so let’s try it with text. I won’t finish it because it gets unwieldy very fast:
A diagram showing a stack. It starts with the operation “Push A”, and now the stack contains the variable “A”; now the stack pushes “B”, which displays now “B” on top of “A”…
This is no solution. It is hard to explain this correctly and accurately without being extremely verbose and frankly, confusing—this defeats the whole purpose of describing the image. The good news, is that computer science diagrams especially tend to lean towards being tabular data. Now to be clear, something does not need to look like a table to be tabular data; this image happens to look almost like a table if you squinted hard enough, but many data not written down in a table, are still “tabular data”. I will show an example of that next! For now though, here is the same idea, same data without words:
| Operator | Stack Values |
|---|---|
| Push A | [A] |
| Push B | [B, A] |
| Push C | [C, B, A] |
| Push D | [D, C, B, A] |
| Pop D | [C, B, A] |
Now this diagram does imply you can pop other items, like “Pop A”, which is just not true. But that’s the fault of the diagram, not the representation of it.
Here is the raw text equivalent (in Markdown):
Operator|Stack Values
---|---
Push A|[A]
Push B|{B, A]
Push C|[C, B, A]
Push D|[D, C, B, A]
Pop (D)|[C, B, A]
Stacks in Memory
So I couldn’t find a good non-copyright image of a stack in memory, but I’ll write it down here in plain text, and you should get the idea. Now again, remember this is still labeled “image” to the student, they do not have access to a text version of this.
( ) ( ( ( ) ) ) ( ) ( ( ) ( ( )
1 0 1 2 3 2 1 0 1 0 1 2 1 2 3 2
Now, someone who looks at this can probably see that the number goes up for a left parenthesis, and down for a right parenthesis. “Image”, however, does not handle the detail. The issue here is a transcriber is likely to want to transcribe this as text. But it’s really not. This is again, tabular data, which is best represented in a table.
Table of this:
| Character | Counter |
|---|---|
| ( | 1 |
| ) | 0 |
| ( | 1 |
| ( | 2 |
| ( | 3 |
| ) | 2 |
| ) | 1 |
| ) | 0 |
| ( | 1 |
| ) | 0 |
| ( | 1 |
| ( | 2 |
| ) | 1 |
| ( | 2 |
| ( | 3 |
| ) | 2 |
Raw text in markdown:
Character|Counter
---|---
(|1
)|0
(|1
(|2
(|3
)|2
)|1
)|0
(|1
)|0
(|1
(|2
)|1
(|2
(|3
)|2
Insanely simple! Look for clues of tabular data. Things which have a one to one correspondence of any kind can usually be represented as a table, even if it’s only “aligned” on the slide or note.
Math Expressions & MathML
Here is a more complex example: using math within a presentation.
Let’s take for example the mathematical expression . This is a very simple math expression that completely breaks in some cases. When converting some math expressions to text, it will convert that expression as , erasing the superscript to denote the exponent.
This gets even worse with large mathematical expressions like this:
Here is what I get by extracting the text from the PDF:
B2U(X ) =

w-1

Σ xi •2
i=0

i
And this is generous, as the sigma sign, bullet point, equal sign and minus sign were for some reason not UTF-8 encoded so it displayed as a chat sign emoji, down arrow, video camera and book sign respectively. Not sure about you, but I certainly can’t get the equation out of that mess.
These can be written in LaTeX, then converted to MathML (an accessible math format) using KaTeX. Here’s an example of what to write to product the function above:
\text{B2U}(X) = \sum_{i=0}^{w-1} x_{i} \times 2^{i}
For someone who is doing transcription as a job for visually impaired students, I would go so far as to say to learn this is a necessity.
- It’s not difficult. You can learn the vast majority of LaTeX math syntax in an afternoon.
- It’s easier for everyone to read. Especially with KaTeX. KaTeX is able to convert the formula to both MathML for screenreader users and HTML markup for people who just want to see those fancy math expressions.
Likely, the teacher is already using some LaTeX derivative to create the math in the first place, they might as well use a program like KaTeX, MathJax or likewise to convert it to MathML.
Code & Output
How did it even happen that entire programs and outputs were just ignored with the label “picture of output” is beyond me. Everything should be transcribed. Whoever transcribed that document should be fired.
Conclusion
To teachers:
Presenting information in plain text, or at least having alternates forms of images, diagrams and math formulas makes education better for everyone, not just blind students. It makes it better for people running on cheaper devices which may not handle running heavy software like Microsoft PowerPoint; it makes it better for people who use operating systems other than MacOS and Windows (this is especially important in the technology sector, where Linux/BSD users make up a sizeable minority of users); and finally, it makes it easier to search through the content of all notes at once using simple text-manipulation tools.
To accessibility departments:
Running a pdftotext program, or simply transcribing handwritten notes is not enough to properly describe slides and notes—handwritten or not.
Every diagram, math equation, annotation, piece of code or output—every single thing must be transcribed to plain text, or some alternate format like MathML.
I find it sad that a student (with their own full-time job) can product better work than someone who has this job exclusively at a major university. Perhaps I am mistaken and the university has volunteers do this work. In that case I guess you can’t ask for too much, but somehow I feel like this is probably not the case.
Big sad.